Ask ten media planners how they measure the success of a digital out-of-home (DOOH) campaign and you will get ten different answers. Impressions delivered. Cost per thousand. Estimated reach. Maybe a footfall study if the budget allowed. In 2026, that answer is no longer good enough. Brands are pushing for proof that DOOH actually shifts the metrics that matter most to a marketing team — awareness, consideration, preference and, ultimately, purchase intent.
Enter the brand lift study, the closest thing programmatic DOOH has to a gold-standard outcome metric. Brand lift studies have been a staple of digital advertising for over a decade, but their application to outdoor is still maturing. With the recent surge in retail-data integrations, mobile panel matching and AI-driven control group modelling, DOOH brand lift studies are finally catching up to their digital cousins — and Australian advertisers are leading some of the most interesting work in the world.
What a DOOH brand lift study actually measures
A brand lift study is, at its core, a controlled experiment. You expose one audience to your campaign, you keep another audience unexposed, and you ask both groups the same questions. The difference in their answers — the lift — is your campaign's incremental effect on brand metrics. The cleaner the control group, the more trustworthy the result.
In DOOH, exposure is inferred rather than observed. A panellist's mobile device may have been seen in proximity to a digital screen during a campaign flight, while a matched non-exposed device was not. Survey responses from both cohorts are then statistically compared. The standard metrics tracked are unaided awareness, aided awareness, ad recall, message association, brand favourability, purchase consideration and recommendation intent.
Unaided awareness — does the brand spontaneously come to mind in category?
Aided awareness — recognition when prompted with the brand name
Ad recall — memory of the specific creative or campaign
Brand favourability — perception shift versus competitors
Purchase consideration — intent to buy in next 30/60/90 days
Recommendation intent — likelihood to refer to others (a proxy for NPS lift)
The methodology shift: from panels to passive identity
Traditionally, brand lift studies in DOOH have relied on panel-based research providers — Pureprofile, Dynata, YouGov and similar — to recruit exposed and unexposed respondents and field a 5-to-7-minute survey. That methodology is reliable but slow, expensive and limited by panel reach. Most studies in Australia field 800 to 1,500 completes split across exposed and control cohorts, and require campaign budgets above $150,000 to be statistically meaningful.
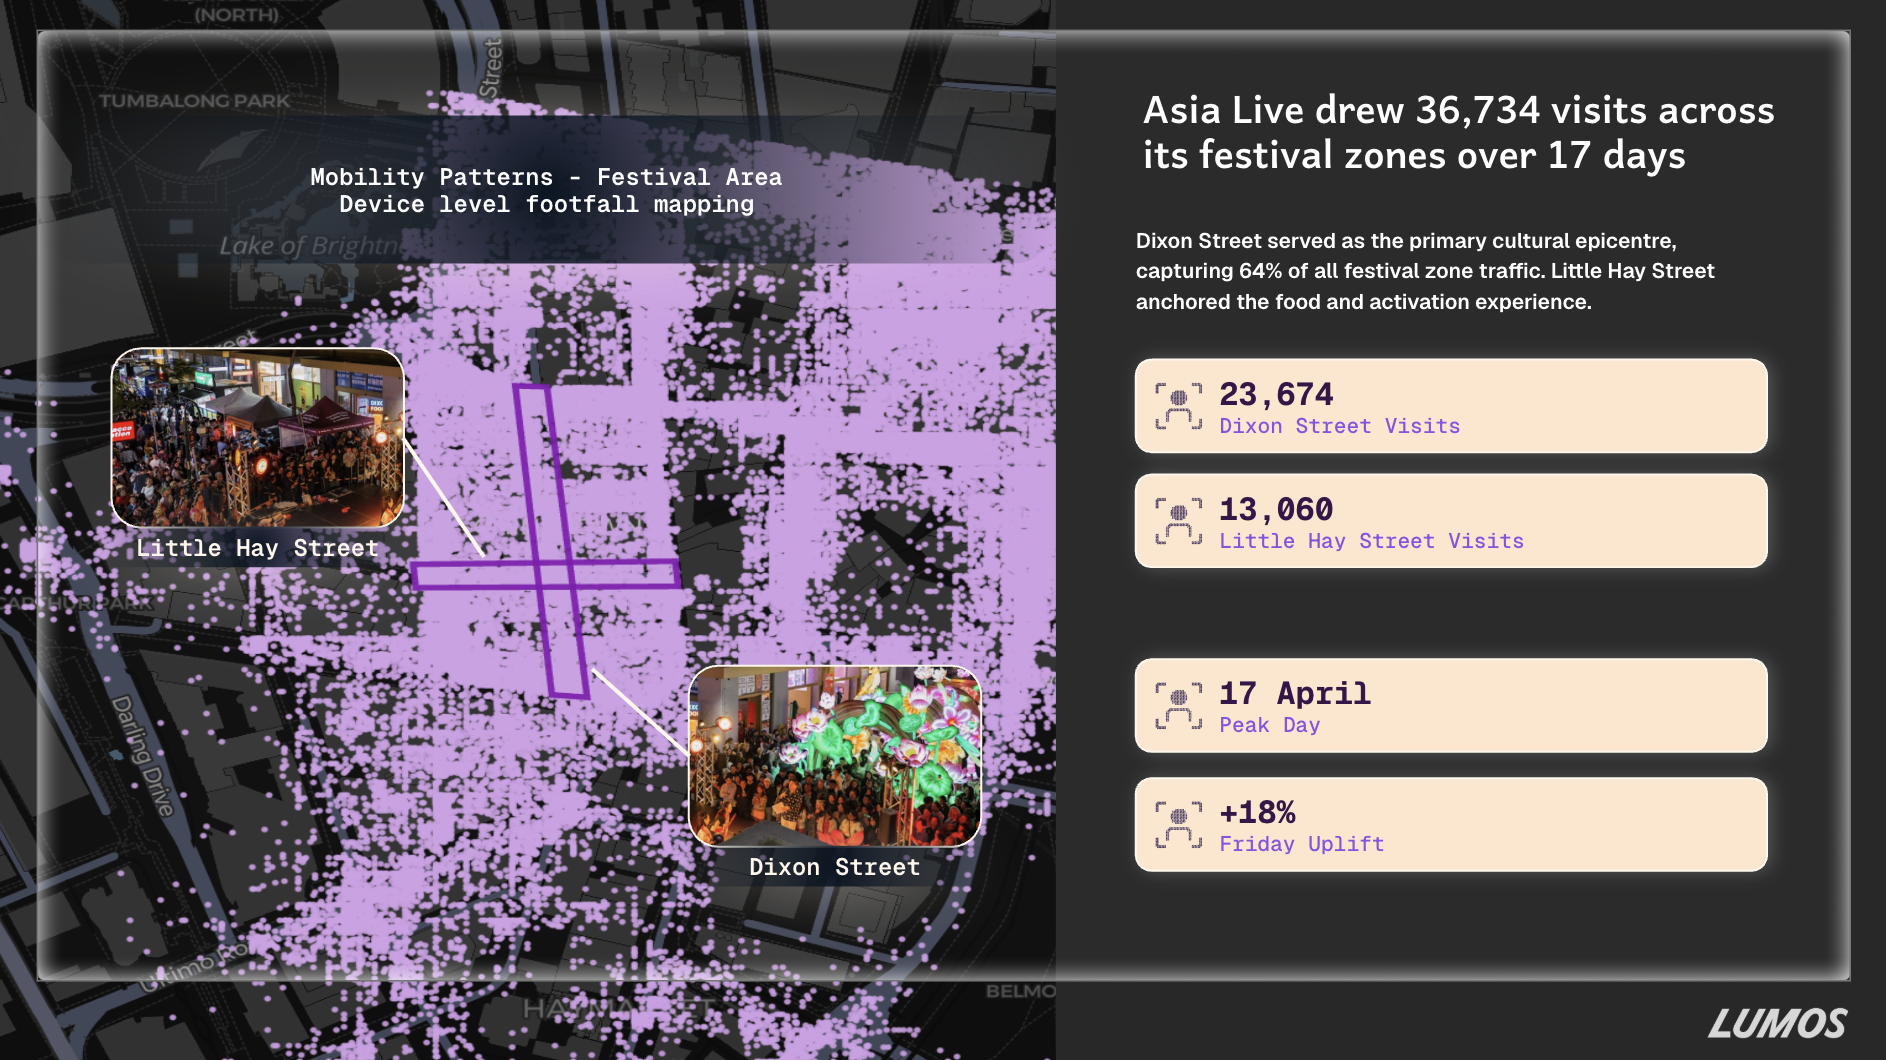
The 2026 shift is toward hybrid methodologies that combine panel surveys with passively observed mobility, transaction and identity signals. Mobility data providers like Azira contribute high-resolution device-level exposure data. Retail partners contribute basket-level purchase signals. Identity layers — like LUMOS ID — stitch the picture together while staying privacy-compliant. The result is a measurement layer that is faster to stand up, cheaper to run, and produces statistically significant lift estimates at lower spend thresholds.
What good benchmarks actually look like
Benchmarks are dangerous things — they invite comparison without context — but advertisers reasonably want to know if their DOOH campaign is performing in line with peers. Aggregating the work we have seen across FMCG, retail, QSR, telco and entertainment categories in Australia and New Zealand, the following ranges hold up. They are directional, not definitive, and they assume a campaign flight of at least four weeks with sufficient frequency to drive recognition.
Unaided awareness lift: 3–7 percentage points for established brands; 8–15 for challenger or new-to-market brands
Aided awareness lift: 5–10 percentage points for the median campaign
Ad recall: 12–25 percentage points lift, depending on creative distinctiveness
Brand favourability: 2–5 percentage points — the hardest metric to move in a short flight
Purchase consideration: 4–8 percentage points lift, higher in QSR and grocery
Recommendation intent: 3–6 percentage points lift
The category matters enormously. A new energy drink launching in summer through high-frequency street furniture will see ad recall figures that would be unattainable for a complex B2B technology brand. The right benchmark is always the same brand's previous campaigns, not someone else's.
We're at the point where DOOH brand lift studies can be standardised across campaigns the way digital lift studies were a decade ago. The brands that build that measurement muscle now will be the ones still spending confidently in DOOH in three years' time. — Eric Fan, CEO, LUMOS
Five practical principles for a credible study
Designing a brand lift study that holds up to scrutiny — from the CMO, the CFO and the agency review — requires discipline. The following five principles separate a publishable result from a presentation slide that nobody trusts.
Define the control group before the campaign goes live, not after. Retro-fitting a control group always introduces bias.
Match exposed and control cohorts on demographics, geography and category behaviour. The closer the match, the cleaner the lift.
Run the study in-flight, not weeks after the campaign ends. Memory decay distorts recall metrics within 14 days.
Pre-register the metrics you are measuring against. Picking the winning metric after the fact is statistical cheating.
Report confidence intervals, not just point estimates. A 6-point lift with a ±5-point confidence interval is not the same as a 6-point lift with a ±1-point interval.
Where brand lift studies fit in the broader measurement stack
Brand lift is one input, not the whole picture. Smart brands triangulate three layers — top-of-funnel brand metrics from lift studies, mid-funnel attention and engagement signals from creative analytics, and bottom-of-funnel outcomes from footfall, transaction or sales lift studies. Each answers a different question. Brand lift tells you whether the campaign changed minds. Footfall and sales tell you whether minds turned into bodies and baskets. Increasingly, advertisers are stitching these layers together into a single measurement spine, often anchored to an identity layer that connects exposure to outcome.
We have seen FMCG advertisers use this stack to make in-flight optimisation decisions — shifting creative weights, dayparts or screen formats mid-campaign based on early lift signals. That used to be a digital-only capability. In 2026, it is increasingly available to outdoor as well.
The road ahead
The next two years will see two big shifts in DOOH brand lift measurement. The first is automation: standardised, always-on lift studies that run continuously across portfolios rather than as bespoke projects. The second is AI-driven cohort modelling, where synthetic control groups built from large behavioural datasets reduce the dependency on panel recruitment and bring study costs down by an order of magnitude. The Australian market — with its mature panel infrastructure, sophisticated retail-data ecosystem and high DOOH penetration — is unusually well-positioned to lead this transition.
For brands that have historically treated DOOH as a media line item without strong measurement, now is the moment to put a brand lift framework in place. The data is there, the methodology is maturing, and the cost of running a credible study has fallen sharply. Brands that build the measurement muscle in 2026 will have the credibility to scale their DOOH investment as the market continues its shift to programmatic.
If you would like to talk through how LUMOS designs and runs brand lift studies for FMCG, retail and category-leading advertisers across AU and NZ, drop us a line via spotlumos.com or reach out to the team directly.
[SCHEMA_ORG]{"@context":"https://schema.org","@type":"Article","headline":"Brand Lift Studies for DOOH: Methodology, Benchmarks and What Good Looks Like in 2026","description":"Brand Lift Studies for DOOH: Methodology, Benchmarks and What Good Looks Like in 2026","image":"https://images.unsplash.com/photo-1450101499163-c8848c66ca85?w=1200&q=80&fm=jpg","datePublished":"2026-06-10","dateModified":"2026-06-10","author":{"@type":"Organization","name":"Lumos","url":"https://spotlumos.com"},"publisher":{"@type":"Organization","name":"Lumos","url":"https://spotlumos.com","logo":{"@type":"ImageObject","url":"https://spotlumos.com/logo.png"}},"mainEntityOfPage":{"@type":"WebPage","@id":"https://spotlumos.com/au/resources/brand-lift-studies-dooh-methodology-benchmarks-2026"},"keywords":"programmatic DOOH, digital out-of-home, audience intelligence, media planning","about":{"@type":"Thing","name":"Programmatic DOOH Advertising"},"isPartOf":{"@type":"WebSite","name":"Lumos","url":"https://spotlumos.com"}}