Ask a CMO in 2026 what keeps them up at night and the answer is rarely 'reach'. It's proof. Proof that the screen on Bourke Street nudged a Woolworths shopper toward the dairy aisle. Proof that the bus shelter creative outside Westfield Bondi influenced a Saturday transaction. Proof that DOOH — long treated as a brand-awareness layer — is doing real work inside an omnichannel funnel.
The good news: the technology to connect digital out-of-home exposure to digital actions and in-store outcomes finally exists at scale. The bad news: most brands and agencies are still wiring it together piece by piece, with inconsistent IDs, opaque panels and last-touch reports that quietly punish upper-funnel channels. This is the practical guide we wish every Australian media planner had on day one.
Why cross-channel attribution for DOOH is finally solvable
Three forces converged in the last 18 months to make connecting DOOH to digital and in-store outcomes genuinely workable. First, programmatic DOOH inventory now carries time-stamped, geo-bounded exposure logs at the impression level — a step change from the broadcast-style reporting of traditional OOH. Second, mobility and transaction datasets have become both richer and more privacy-safe, with clean-room infrastructure (LiveRamp, Snowflake, AWS Clean Rooms) handling match-and-measure without exposing raw identifiers. Third, the AU/NZ measurement industry has matured: IAB Australia's cross-media measurement framework and the OMA's MOVE 2.0 currency rollout have given the market a shared vocabulary for exposure and outcome.
The result is that attribution is no longer 'can we do it?' but 'which method matches this campaign?' According to recent industry surveys, more than 70% of Australian advertisers now run some form of multi-touch or incrementality study on their OOH spend — up from roughly 30% in 2023. Outdoor is no longer the channel that gets a vague 'reach and frequency' slide at the end of the wash-up.
The three layers of the modern DOOH attribution stack
Every workable cross-channel measurement setup has the same anatomy. Get these three layers right and 80% of attribution headaches disappear.
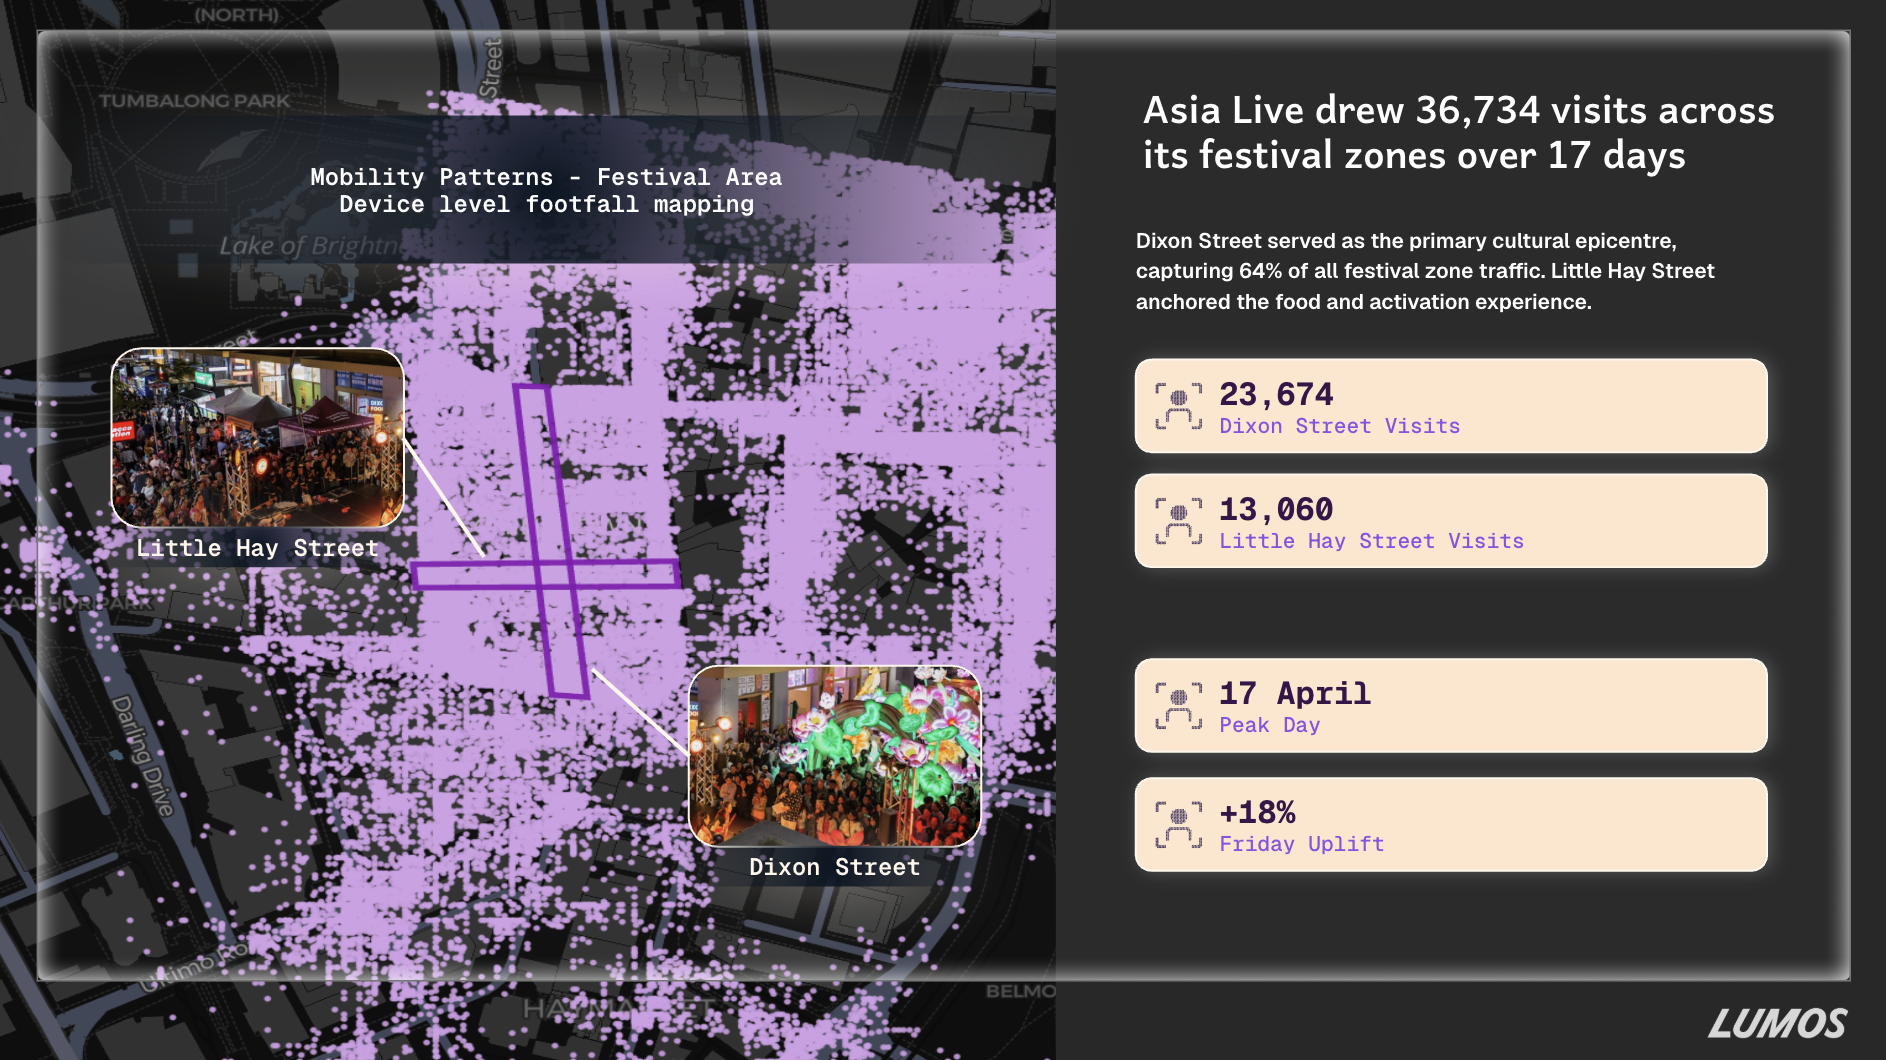
Exposure layer — Impression-level DOOH logs with timestamp, screen ID, lat/long, dwell estimate and audience index. This is what programmatic DOOH platforms produce natively and traditional OOH cannot.
Identity layer — A privacy-safe bridge between exposed audiences and downstream behaviours. In Australia this typically means device-graph IDs, hashed first-party IDs, or clean-room joins. LUMOS ID is built specifically to act as this bridge for OOH.
Outcome layer — The thing you're actually trying to measure. Website visits, branded search lift, app installs, retail visits, EFTPOS transactions, loyalty scans. Each outcome has its own latency and confidence profile.
Inference layer (optional but recommended) — Statistical models that turn raw matches into causal estimates. This is where incrementality testing and media mix modelling do the heavy lifting.
Method 1 — Exposed vs. unexposed for digital outcomes
The workhorse method for DOOH-to-digital attribution is exposed-vs-unexposed analysis. Devices that passed within a defined radius and dwell window of an active DOOH screen form the exposed cohort. A statistically matched control cohort — same demographics, same geography, same baseline behaviour, simply not exposed — forms the comparison group. The lift in branded search, site visits or app opens between the two cohorts is your causal effect.
Done well, this method produces clean incrementality numbers and can be turned on for almost any campaign with sufficient scale. Done poorly — small samples, sloppy control matching, ignored seasonality — it produces noise that flatters the agency and misleads the client. The discipline is in the matching, not the math.
Method 2 — DOOH to in-store via mobility and retail data
For brands where the conversion lives in the aisle — FMCG, QSR, automotive, telco, banking — DOOH attribution increasingly runs through retail data partnerships. The mechanic is straightforward in theory: exposed device cohorts are matched (in a clean room) to anonymised retail visit data from mobility providers like Azira, or to transaction panels from supermarket and card networks. The output is a verified visitation or sales lift attributable to the DOOH exposure window.
This is where Australia has a structural advantage. The MOVE 2.0 currency, the maturity of card-data partnerships, and a tight retail media ecosystem (Cartology, Coles 360, Endeavour, World of Wine) mean a closed-loop DOOH-to-basket measurement is now realistic for any FMCG brand with a competent media partner.
The brands winning at DOOH in 2026 aren't the ones spending more — they're the ones who can prove what their last campaign did. Once you have that proof, the next budget conversation becomes very different. — Eric Fan, CEO, Lumos
Method 3 — MMM and unified measurement for the full picture
Exposure-based methods are great for individual campaigns. They're not great for answering the big board-room question: 'How much should we spend on DOOH next year, and where does it sit relative to TV, BVOD, social and search?' For that you need a media mix model — a top-down statistical model that decomposes business outcomes (sales, revenue, leads) into the contribution of each channel, controlled for price, distribution, seasonality and competitor activity.
The recent wave of open-source MMM tools (Meta Robyn, Google Meridian) has democratised this practice, but DOOH inputs need careful preparation. Spend alone is a weak feature; impression-weighted reach, frequency, and audience-quality indices produce far better fits. The most sophisticated brands now run unified measurement: MMM for budget allocation, multi-touch and incrementality testing for in-flight optimisation, and exposure-based studies to validate specific creative and placement choices.
Common pitfalls — and how to avoid them
After working alongside dozens of AU/NZ advertisers on attribution programmes, the same traps come up over and over. Most are not technical — they are operational.
Measuring the wrong outcome. A brand campaign measured on next-day transactions will always underperform. Match the KPI to the funnel stage.
Tiny exposed cohorts. Below ~50,000 unique exposed devices the noise will swamp the signal. Either scale the buy or aggregate across flights.
Last-touch leakage. If your client still reports DOOH against a last-touch dashboard, attribution work is academic. Fix the reporting layer first.
Skipping the control. 'Lift' without a control group is not lift. It is a number that looks like lift and behaves like marketing theatre.
Treating measurement as a one-off. Attribution is a programme, not a project. Build a cadence, build a baseline, and review quarterly.
What good looks like in 2026
The benchmark for a well-attributed DOOH campaign in Australia today is a measurement stack that can answer four questions inside two weeks of campaign close: Did we reach the audience we planned? Did exposure drive measurable lift in a digital or physical action? How does that lift compare to the cost of the channel? And what should we change next time? Brands and agencies that can answer those four questions consistently will keep winning budget from finance. Those that can't will keep losing share to channels that can.
DOOH has spent two decades being measured like a billboard and bought like a hope. That era is closing. The combination of programmatic infrastructure, mobility and retail data, and clean-room identity means digital out-of-home is now measurable to the same standard as digital display — and increasingly, to a higher standard, because the exposure data is harder to game.
If you're building or rebuilding a cross-channel measurement programme this quarter, the team at Lumos can help you scope the right stack, choose the right method per campaign and stand up a closed-loop measurement workflow that finance, marketing and your media agency will all sign off on. Drop us a line at spotlumos.com or reach out to the team directly.
[SCHEMA_ORG]{"@context":"https://schema.org","@type":"Article","headline":"Connecting DOOH to Digital and In-Store: The Practical Attribution Guide","description":"Connecting DOOH to Digital and In-Store: The Practical Attribution Guide","image":"https://images.unsplash.com/photo-1554224155-6726b3ff858f?w=1200&q=80&fm=jpg","datePublished":"2026-05-11","dateModified":"2026-05-11","author":{"@type":"Organization","name":"Lumos","url":"https://spotlumos.com"},"publisher":{"@type":"Organization","name":"Lumos","url":"https://spotlumos.com","logo":{"@type":"ImageObject","url":"https://spotlumos.com/logo.png"}},"mainEntityOfPage":{"@type":"WebPage","@id":"https://spotlumos.com/au/resources/connecting-dooh-digital-in-store-attribution-guide-2026"},"keywords":"programmatic DOOH, digital out-of-home, audience intelligence, media planning","about":{"@type":"Thing","name":"Programmatic DOOH Advertising"},"isPartOf":{"@type":"WebSite","name":"Lumos","url":"https://spotlumos.com"}}