Ask ten media planners what powers a high-performing programmatic DOOH campaign in 2026 and you'll get two camps. One swears by rich audience data — demographics, mobility patterns, lifestyle segments. The other points to transaction data — what people actually bought, where, when, and how often. Both are right. Both are also incomplete on their own. The brands getting the strongest results from DOOH this year are the ones learning when to lean on each, and how to fuse them inside a single buying decision.
Retail media has moved this conversation from theoretical to operational. With Australian retail media spend forecast to top A$1.6 billion in 2026 (IAB Australia), and supermarket and pharmacy networks now offering programmatic access to first-party transaction signals, the question isn't whether to use retail data in DOOH — it's how to use it without losing the reach and scale that make out-of-home valuable in the first place.
What we actually mean by audience data and transaction data
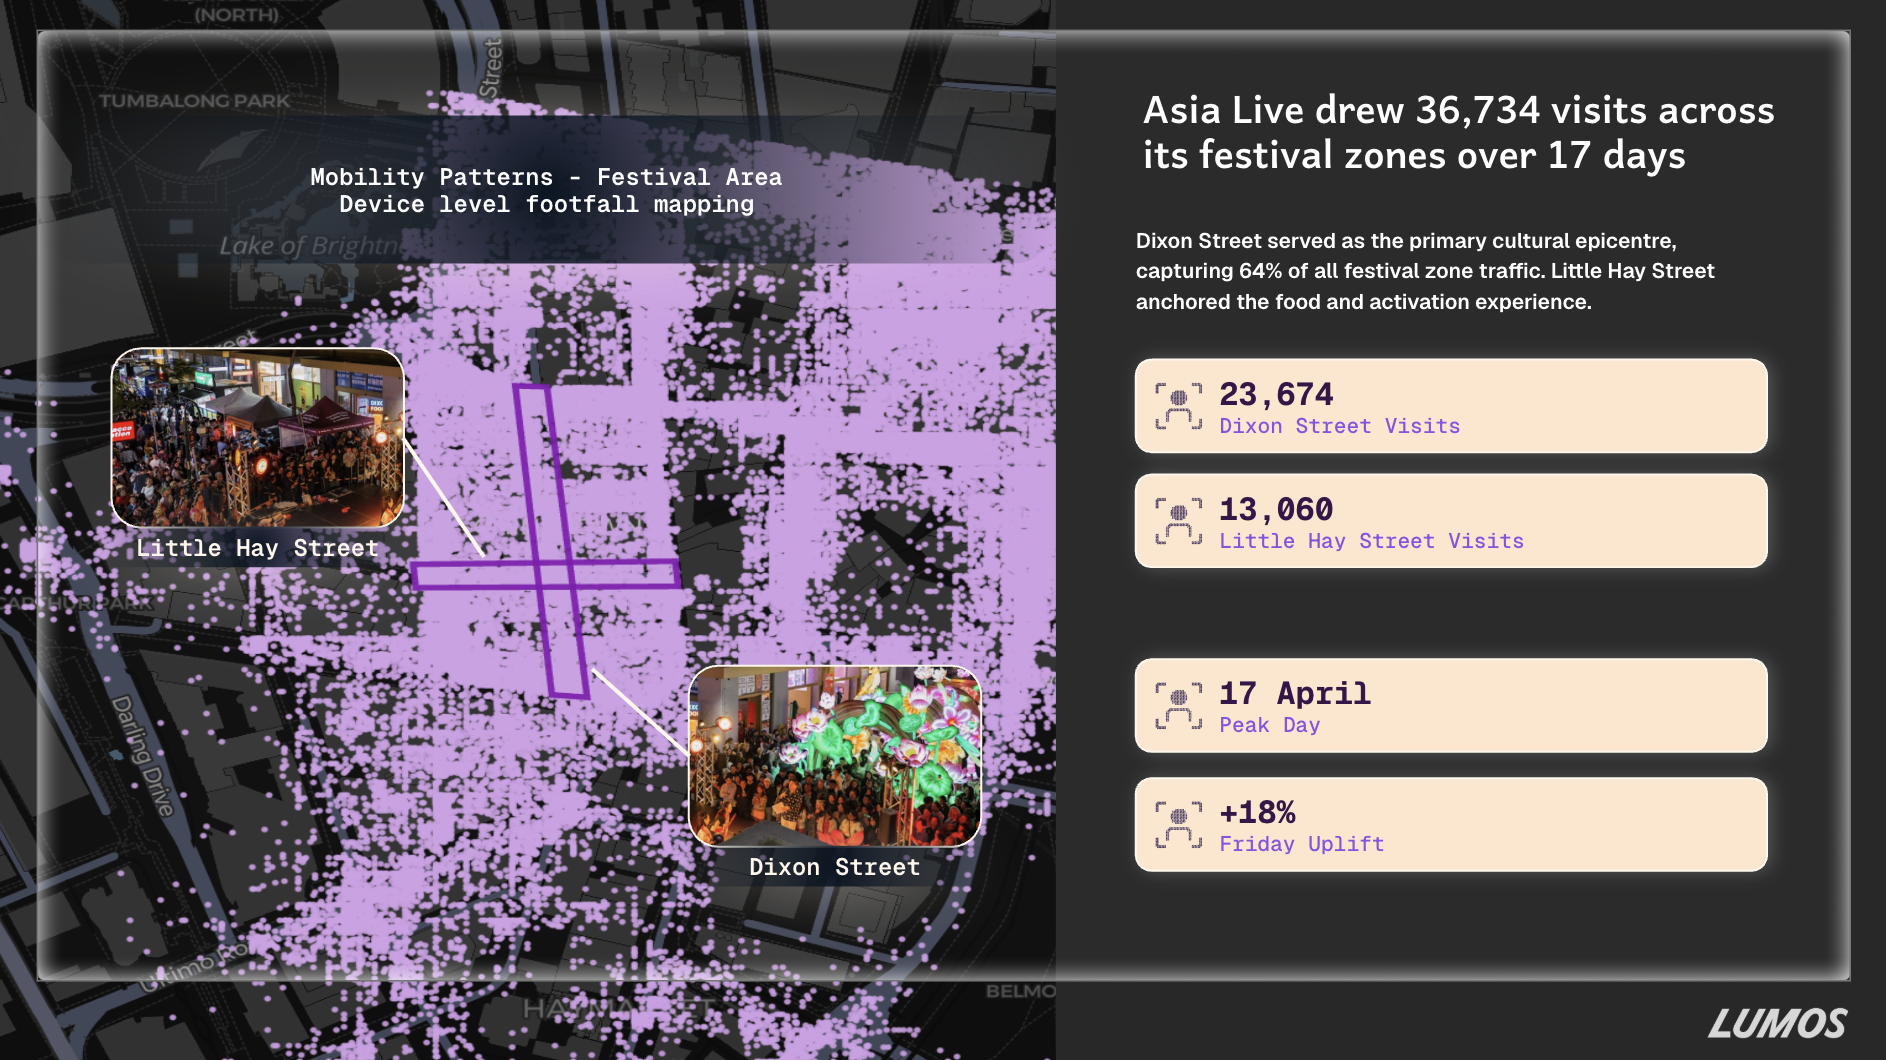
Audience data describes who a person is and how they behave: age, gender, household composition, mobility patterns, content affinities, location frequency, dwell time at certain types of venues. It's typically modelled from panel sources, mobile SDKs, mobility providers, and identity graphs. In DOOH, it tells you which screens are most likely to be in front of the right kind of person at the right moment.
Transaction data describes what a person actually did with their wallet. Basket-level purchase records, loyalty programme activity, category spend, brand switching, recency, frequency and monetary value. It comes from retailers, banks, payment processors and loyalty operators. In DOOH, it tells you which screens are most likely to influence a measurable commercial outcome — a sale — rather than just an impression.
The two are often confused because both end up as audience segments inside a DSP. But conceptually they answer different questions. Audience data answers 'who is likely to be exposed and receptive?' Transaction data answers 'who is likely to convert, and is worth more when they do?'
Where audience data wins
Audience data still does the heavy lifting at the top of the funnel. When the objective is reach against a defined consumer — new movers, weekend cafe-goers, parents of school-age children, gym regulars — there is no substitute for a well-modelled audience graph mapped to OOH inventory. Audience data is also indispensable for categories without a clean purchase signal: telcos, automotive, finance, travel, government, and most B2B.
Brand-building campaigns where exposure quality matters more than immediate sales attribution
Categories with long or offline purchase cycles (auto, finance, real estate, travel)
Launch campaigns targeting lookalikes of existing customers
Geographic and contextual targeting where transaction signals are sparse
Cross-screen extension where DOOH amplifies a digital audience already in market
Where transaction data wins
Transaction data is unbeatable when the goal is measurable commercial lift in a defined category. For FMCG, QSR, retail, pharmacy and grocery brands, knowing who bought your product (or your competitor's) in the last 30 days — and what they paid — is more predictive of advertising response than any modelled persona. It also turns DOOH from a top-funnel channel into a lower-funnel one, because every impression can be tied back to a basket within a known window.
Recent Australian Brand Lift Studies run across grocery and snack categories have consistently shown 1.5x to 2.4x higher purchase intent uplift when DOOH inventory is bought against verified category buyers versus broad demographic targeting. That gap is real money on a national flight.
Transaction data isn't replacing audience data — it's giving the audience layer a job to do. We use audience signals to find the right people, then transaction signals to prove the campaign moved baskets. When both layers agree, performance compounds. — Eric Fan, CEO, Lumos
The fusion approach: where DOOH performance actually lives
The most effective programmatic DOOH activations in 2026 don't pick a side. They stack the two data types. Audience intelligence defines the addressable pool — say, the 1.8 million Australians most likely to be in-market for a premium chocolate brand based on category affinity and mobility. Transaction data then sharpens the pool — filtering to verified category buyers in the last 90 days, weighted by basket size. The DSP buys impressions where both signals overlap with the screen's audience curve.
This is where omni-channel measurement becomes critical. Without a clean way to connect DOOH exposure back to a transaction, you can't tell whether the fusion is working. Brands that invest in unified measurement — typically a mix of mobility-based exposure logs, retailer data clean rooms, and incrementality testing — see compounding returns campaign over campaign because each flight teaches the model.
Practical playbook for AU/NZ brands
If your team is sitting on first-party loyalty or transaction data and hasn't yet activated it in DOOH, the path is shorter than most marketers assume. The retail media networks now offer clean room integrations with major DSPs, and identity resolution layers like LUMOS ID make it possible to bridge transaction segments to DOOH inventory without exposing personal data. Three moves to make this quarter:
Audit which of your audience segments are modelled and which are observed — observed transaction signals should drive your performance flights
Run at least one matched-market test comparing a pure audience-data buy against a fused audience-plus-transaction buy, measured with incrementality
Insist on basket-level outcome reporting from your DOOH partners, not just impression delivery and reach
The bottom line
Audience data tells you who to reach. Transaction data tells you who's worth reaching. In DOOH, where every impression is a paid moment of attention on a public screen, choosing one over the other leaves performance on the table. The brands winning in 2026 are running both — and measuring like it matters.
Want to see how Lumos blends audience intelligence with retail and transaction data across our DOOH network in Australia and New Zealand? Visit spotlumos.com or get in touch — we'll walk you through a live campaign setup.
[SCHEMA_ORG]{"@context":"https://schema.org","@type":"Article","headline":"Transaction Data vs Audience Data: What Really Drives DOOH Performance","description":"Transaction Data vs Audience Data: What Really Drives DOOH Performance","image":"https://images.unsplash.com/photo-1556740738-b6a63e27c4df?w=1200&q=80&fm=jpg","datePublished":"2026-05-13","dateModified":"2026-05-13","author":{"@type":"Organization","name":"Lumos","url":"https://spotlumos.com"},"publisher":{"@type":"Organization","name":"Lumos","url":"https://spotlumos.com","logo":{"@type":"ImageObject","url":"https://spotlumos.com/logo.png"}},"mainEntityOfPage":{"@type":"WebPage","@id":"https://spotlumos.com/au/resources/transaction-data-vs-audience-data-dooh-performance-2026"},"keywords":"programmatic DOOH, digital out-of-home, audience intelligence, media planning","about":{"@type":"Thing","name":"Programmatic DOOH Advertising"},"isPartOf":{"@type":"WebSite","name":"Lumos","url":"https://spotlumos.com"}}